Conversational AI Agent for Data-Intense Dashboards
Transforming Dashboard Intelligence with Agentic AI
I led the design of a Gen AI agent for an end-to-end conversational experience that gives business users access to insights across multiple data sources and dashboards, reducing time to insight. The solution let users ask questions without needing to know prompt engineering surfacing the right analysis option and saving hours of digging through the right datasets.
I increased the dashboard analysis efficiency by 30% introducing a new experience to analyze data that makes sense to the business.
Role
Lead Product Designer
Timeline
~4 Months
Tools
Figma, Figma Make, FigJam, Claude
Due to NDA, some content and specifics have been redacted.
Scroll to read the case study
The problem
One survey surfaced a gap between what the dashboards reported and what people actually needed from them
Our client’s internal employee survey found an interesting fact: users were spending real time just finding the right answer to their question, and that alone was hurting their overall efficiency. Claims analysts and claims managers were going back and forth between the database and existing reports, which led to inconsistent numbers and even more time spent chasing an answer; not to mention multiple copies of the same report, each built to serve a different person’s version of the question.
01
High-stakes decision friction & report lag
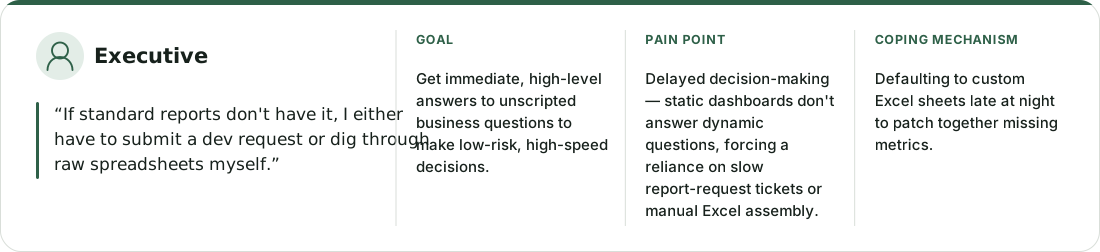
Executives are forced to make critical, time-sensitive business decisions based on outdated or surface-level data. When existing dashboards lack specific answers, they face a lose-lose choice: wait days or weeks for data engineering or BI teams to build a custom report, or spend precious executive hours manually hacking together fragmented data in Excel.
02
Data fragmentation & investigative exhaustion
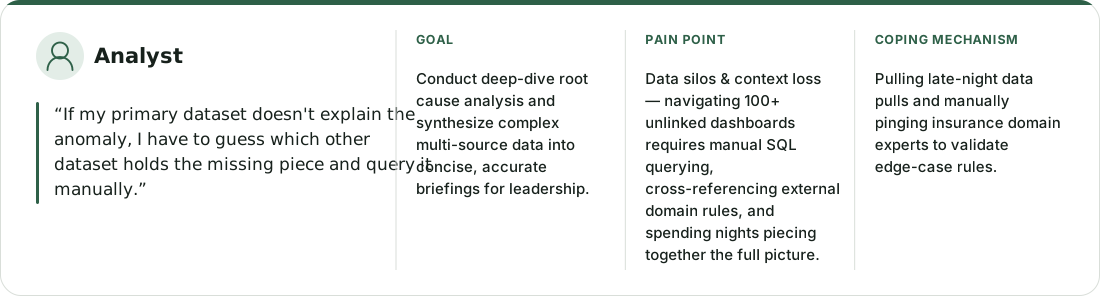
Analysts spend 80% of their time hunting and stitching data across dozens of disparate systems (and verifying business logic with domain experts) rather than actually analyzing it. When an anomaly occurs, finding the true root cause requires tedious, manual query-building across unlinked databases, under immense pressure to report back to executives.
Reframing the goal
This wasn’t a dashboard problem, it was a reasoning problem
The first instinct was to fix the dashboard with better filters, a cleaner view, maybe a saved report for the region in question. But the real gap wasn’t visibility, it was translation: someone making a high-stakes decision doesn’t need another chart, they need someone to read the chart for them, in the few minutes before they have to act on it. That’s not a dashboard problem. It’s a reasoning problem which meant the fix couldn’t be a better view of the data. It had to be something that could look at the data, form a judgment, and say so in plain language.
Why agentic AI
A single chatbot wouldn’t hold up. An agent could reason through the problem, not just answer it
Context: the agent can handle the context of a conversation on a much larger scale.
Domain-specific knowledge: we can ground it in the knowledge and context of the domain insurance, in this case specific to the client and their environment.
User-persona-specific guardrails: guardrails tailored to generate specific output based on the input are crucial, and agentic AI handles this far better than a single model.
Data handling: federated multi-source orchestration across 100+ live datasets, without building new ETL pipelines.
Adaptability: dynamic query execution via a DB Code Interpreter, to compute net-new logic on the fly.
Problem solving: multi-step reasoning that explains why something happened and recommends a next step — root cause analysis, not just a number.
Building the agent
From domain modeling to orchestration designing the system, not just the screen
My skills in a nutshell:
Domain Context Modeling: collaborated with insurance domain experts to translate complex LTC claim lifecycles into agent context rules.
Archetype & Intent UX: mapped user organizational tiers into 3 dynamic output modes Concise, Detailed, and Root Cause.
Agent Orchestration Mapping: co-designed the workflow pipeline connecting input queries to semantic layers, code execution tools, and persona-tailored outputs.
The 3 pillars
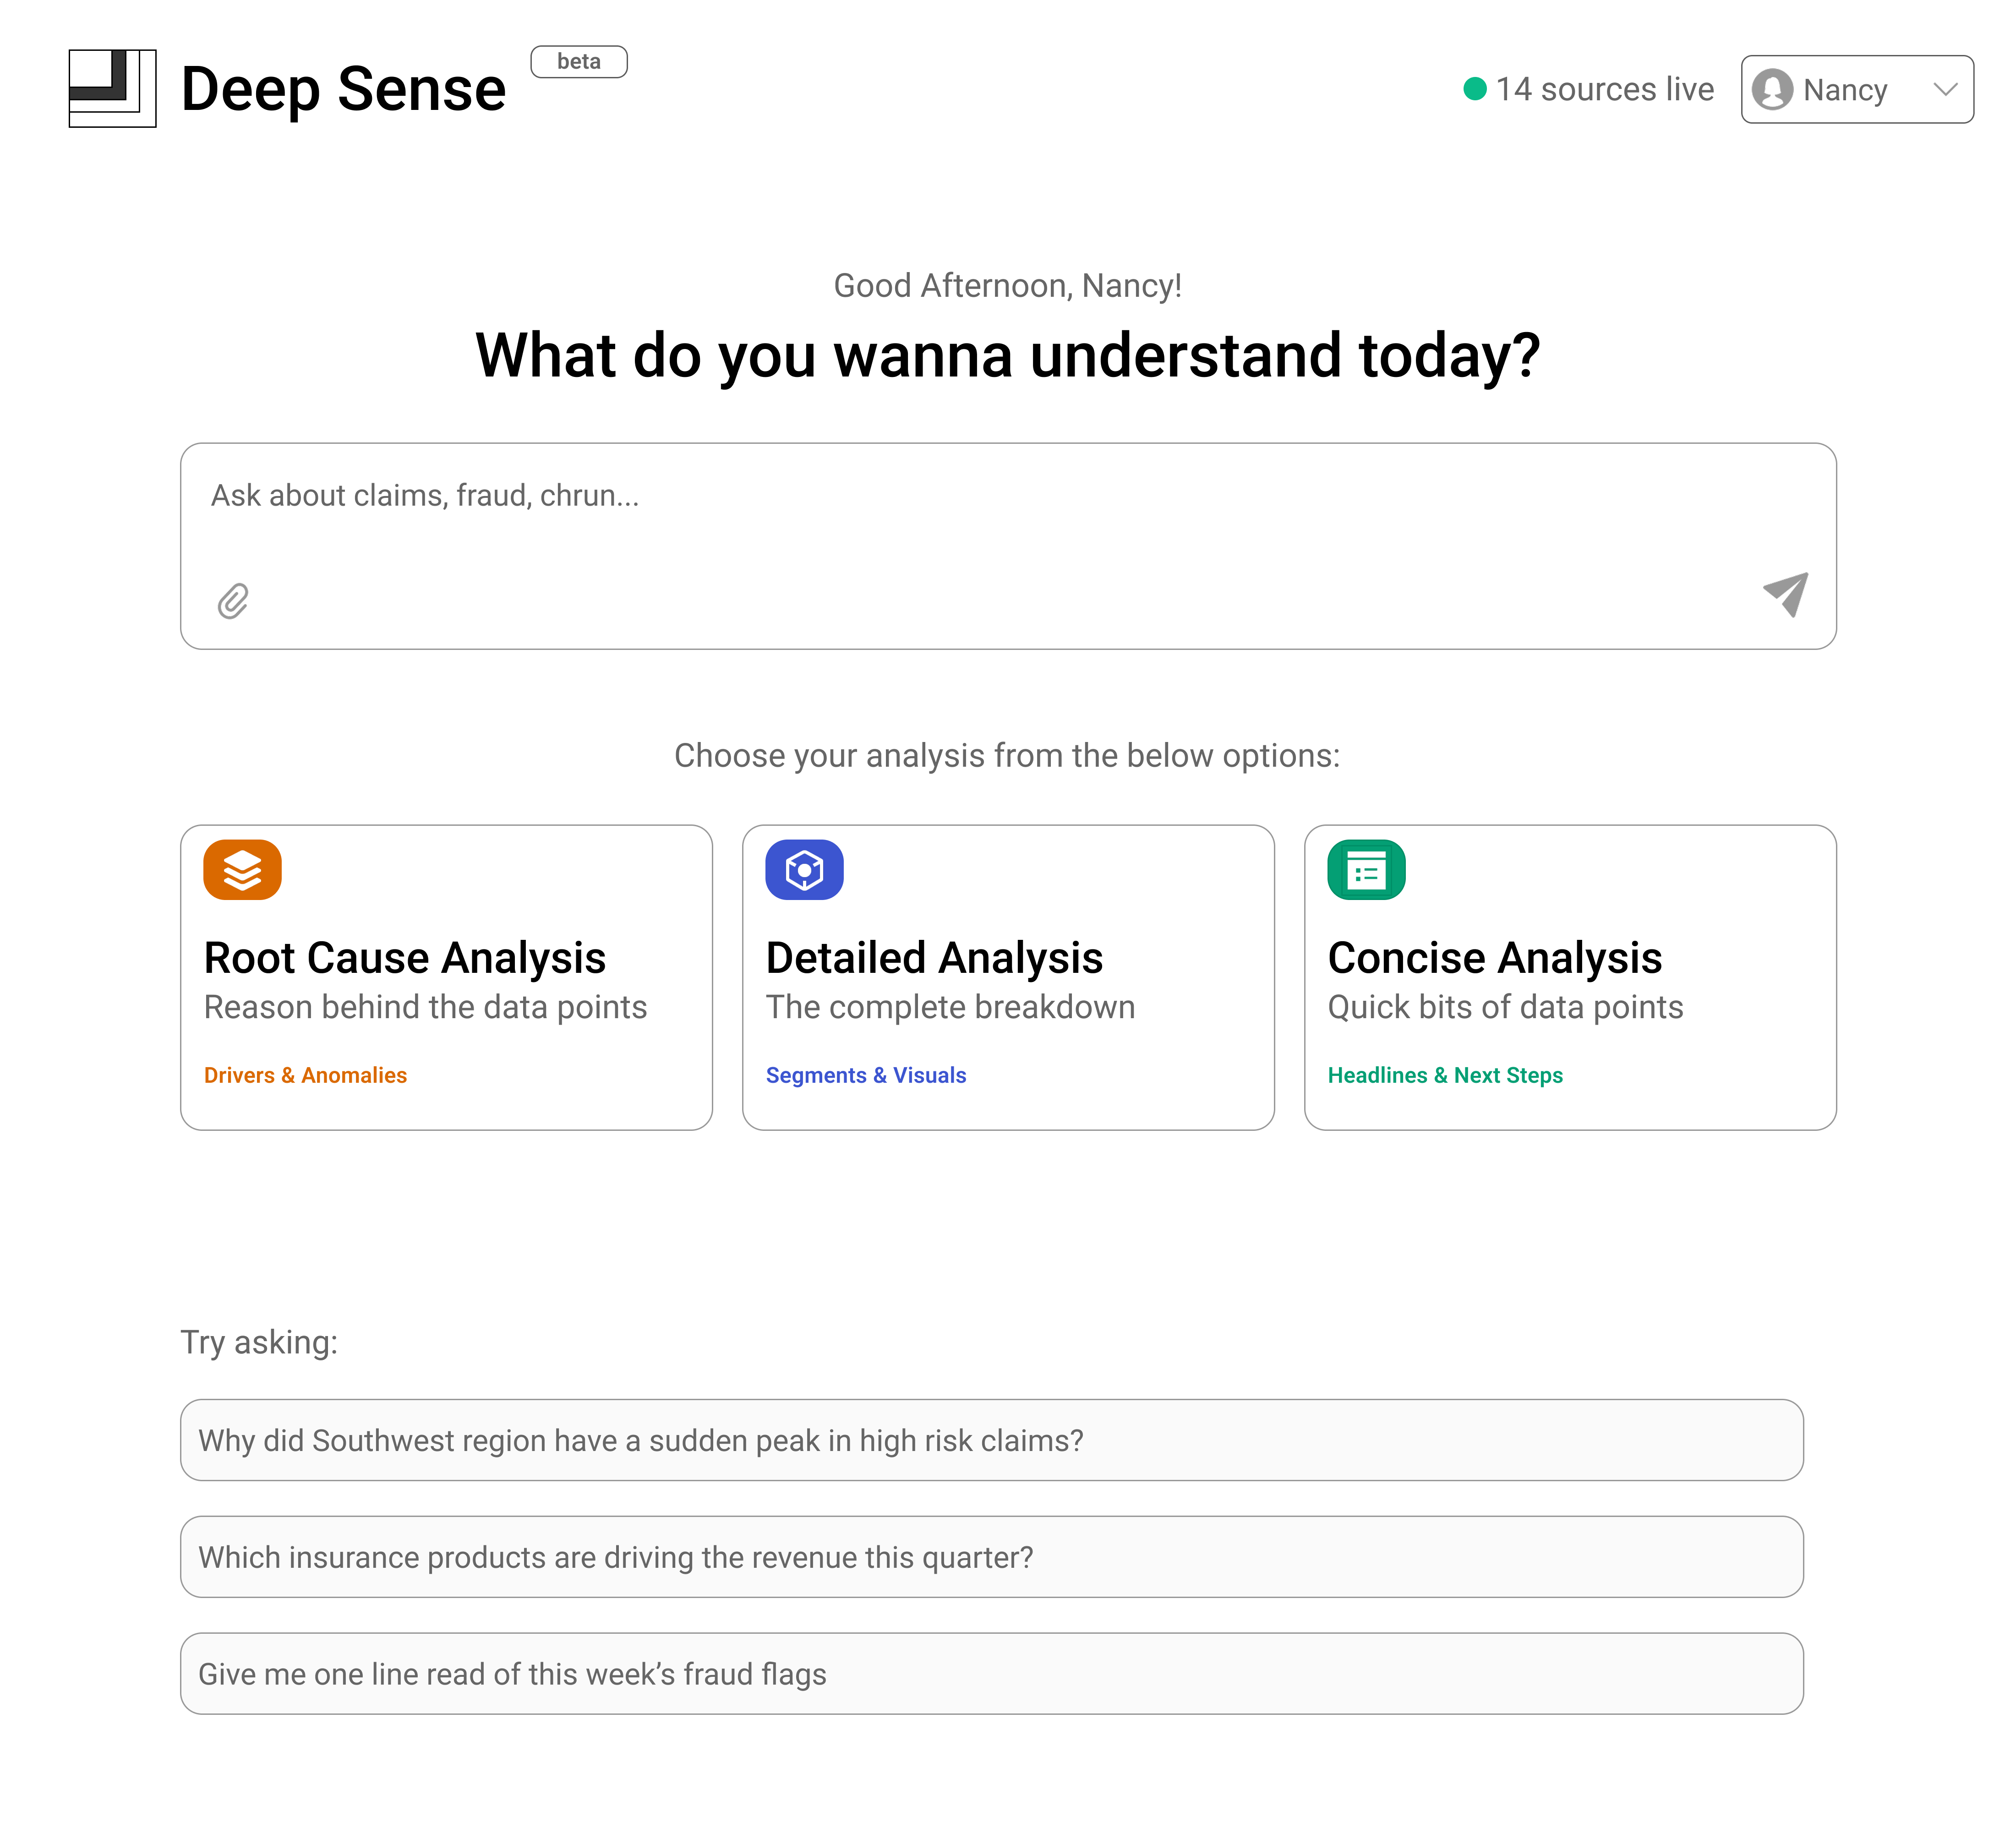
Root Cause Analysis
Primarily designed for claims analysts to find specific data points and the reasons behind any changes in them.
Detailed Analysis
Designed for claims managers who need a level up from an analyst’s view like a dashboard, but as a proactive conversation instead of static visuals, with on-the-go dynamic visuals to make sense of related data points.
Concise Analysis
Built for executives who need the headline summary of the data points, and what teams are doing in response.
Important guardrails
Break down data per the persona’s needs, and answer in a way that matches an analyst’s mental model for root cause analysis.
Summaries for executives always carry the latest updates, kept short and easy to consume.
Always show which data sources were used, and report names where relevant and always show the process used to collect the data, to keep trust intact.
Explainability markers show a confidence score on every output.
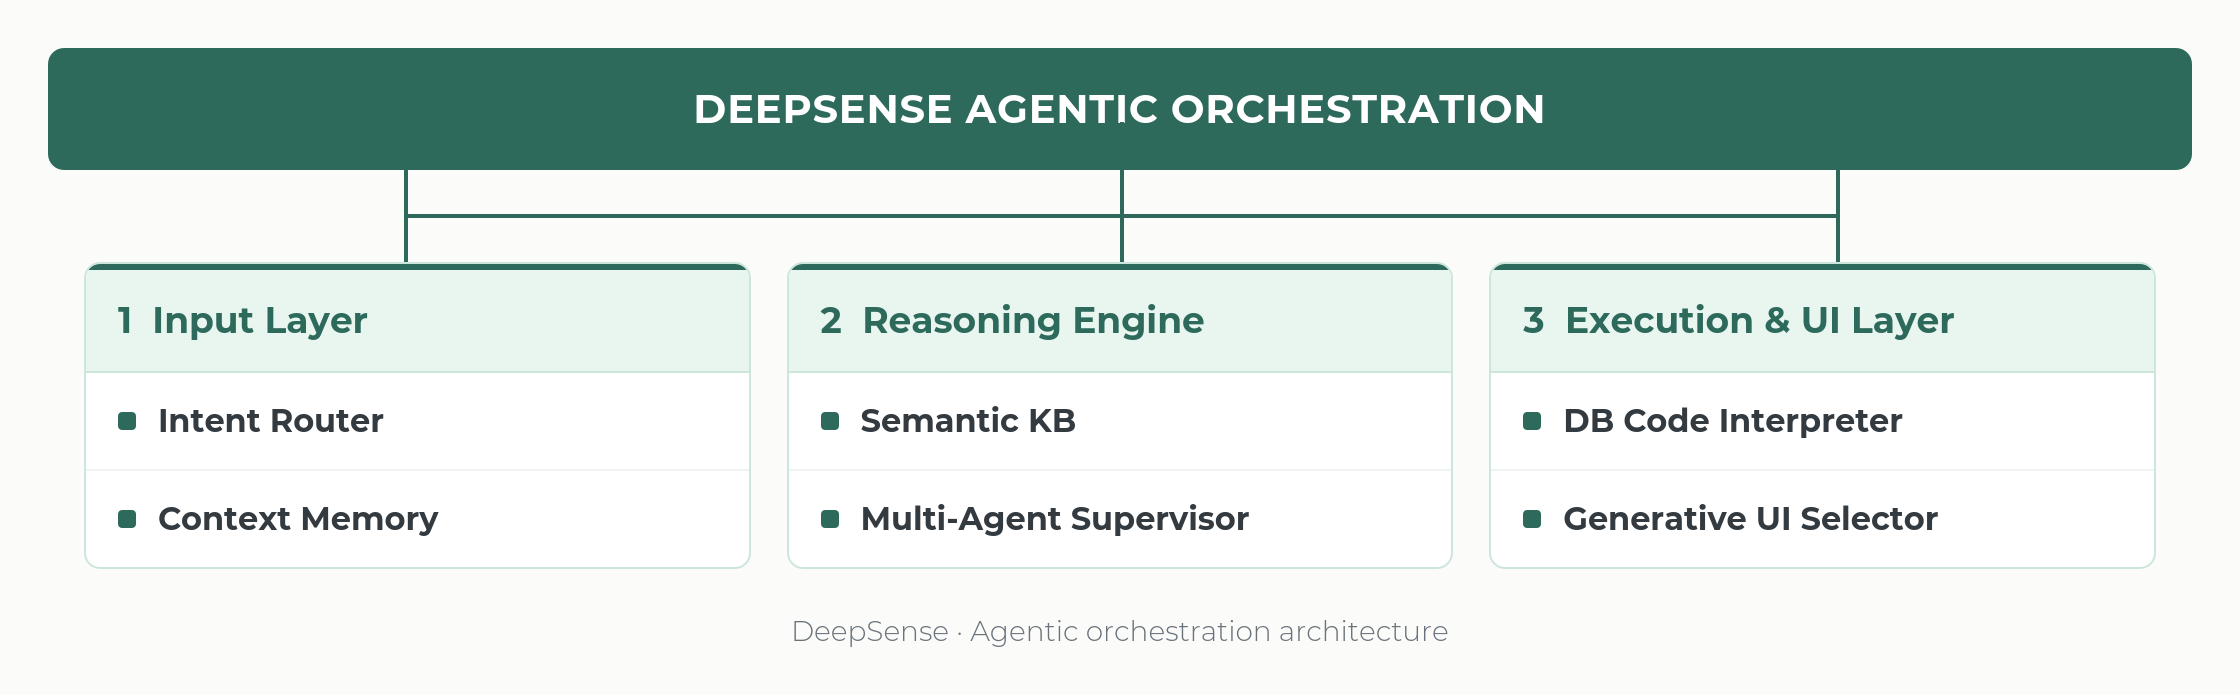
Agent orchestration
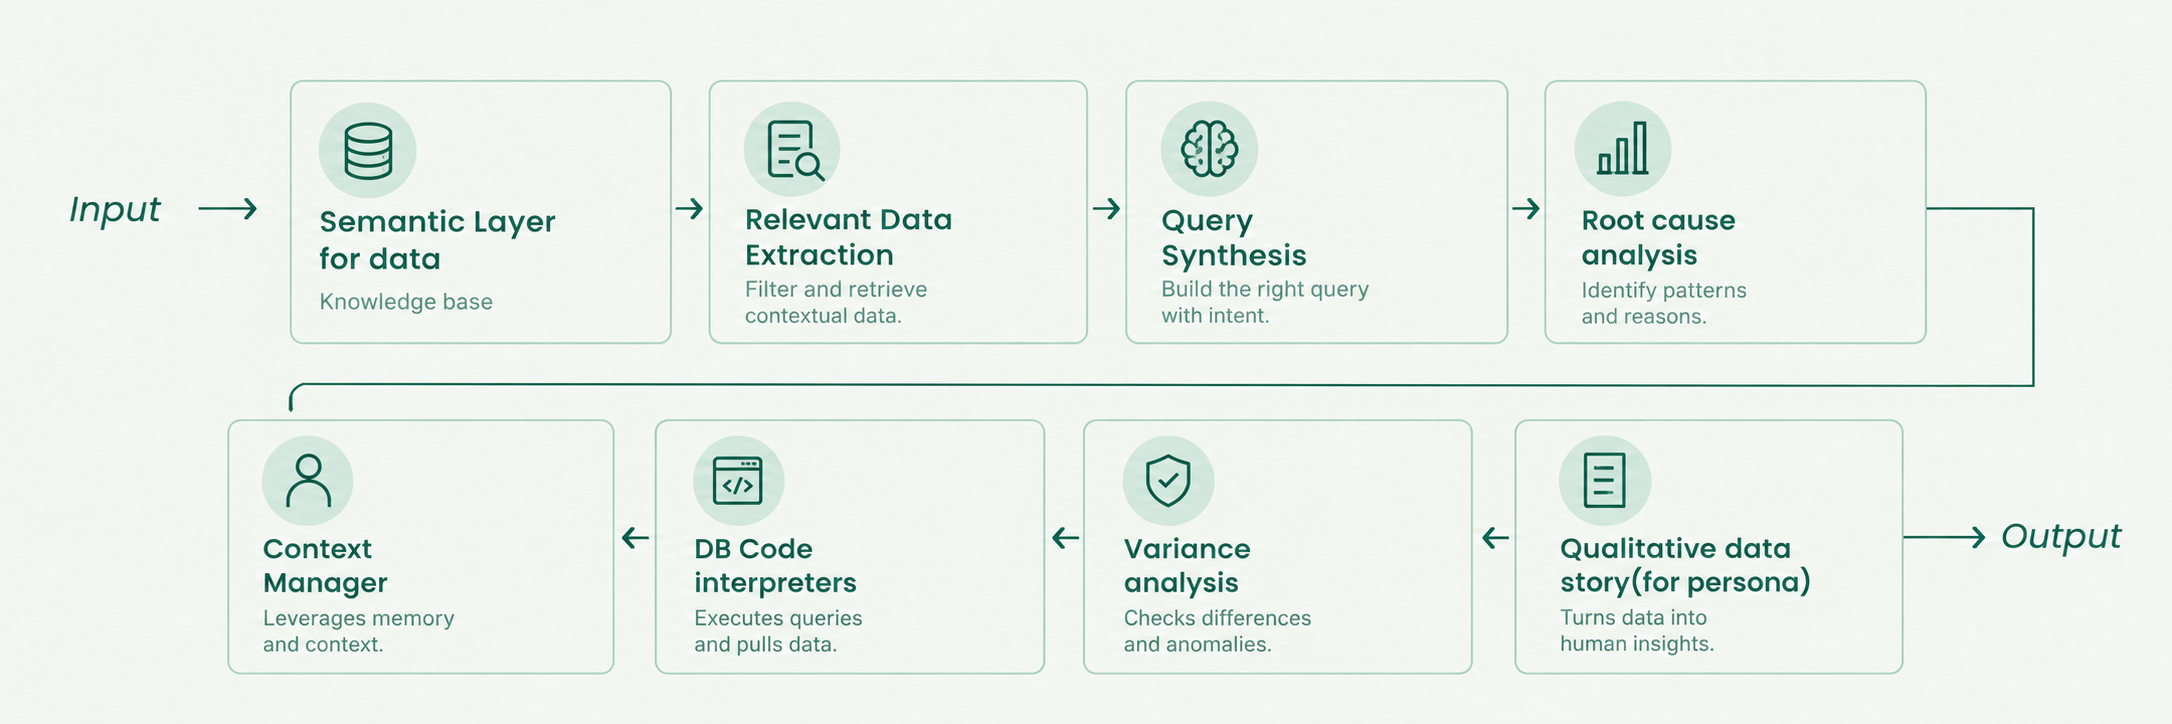
DeepSense · Agentic orchestration architecture
Intent Router Agent: classifies the user query as Concise Analysis (Executive) or Root Cause Analysis (Analyst) to set the reasoning depth.
Context & Memory Layer: retains active conversation history and user persona state, so baseline data doesn’t get re-queried.
Semantic Knowledge Base (LTC domain rules): the ground-truth policy engine. Translates ambiguous insurance jargon (for example, “high-risk benefit exhaustion”) into exact DB schema filters.
Supervisor Agent (Orchestrator): breaks complex queries into multi-step sub-tasks, chooses which downstream tools to call, and verifies their outputs.
Database Code Interpreter: dynamically generates and runs sandboxed SQL/Python scripts to join disparate datasets and calculate variances on the fly.
Adaptive UI / Layout Selector: translates raw computational output into human-readable visual components a summary bullet card versus an anomaly diagnostic chart.
Agent workflow
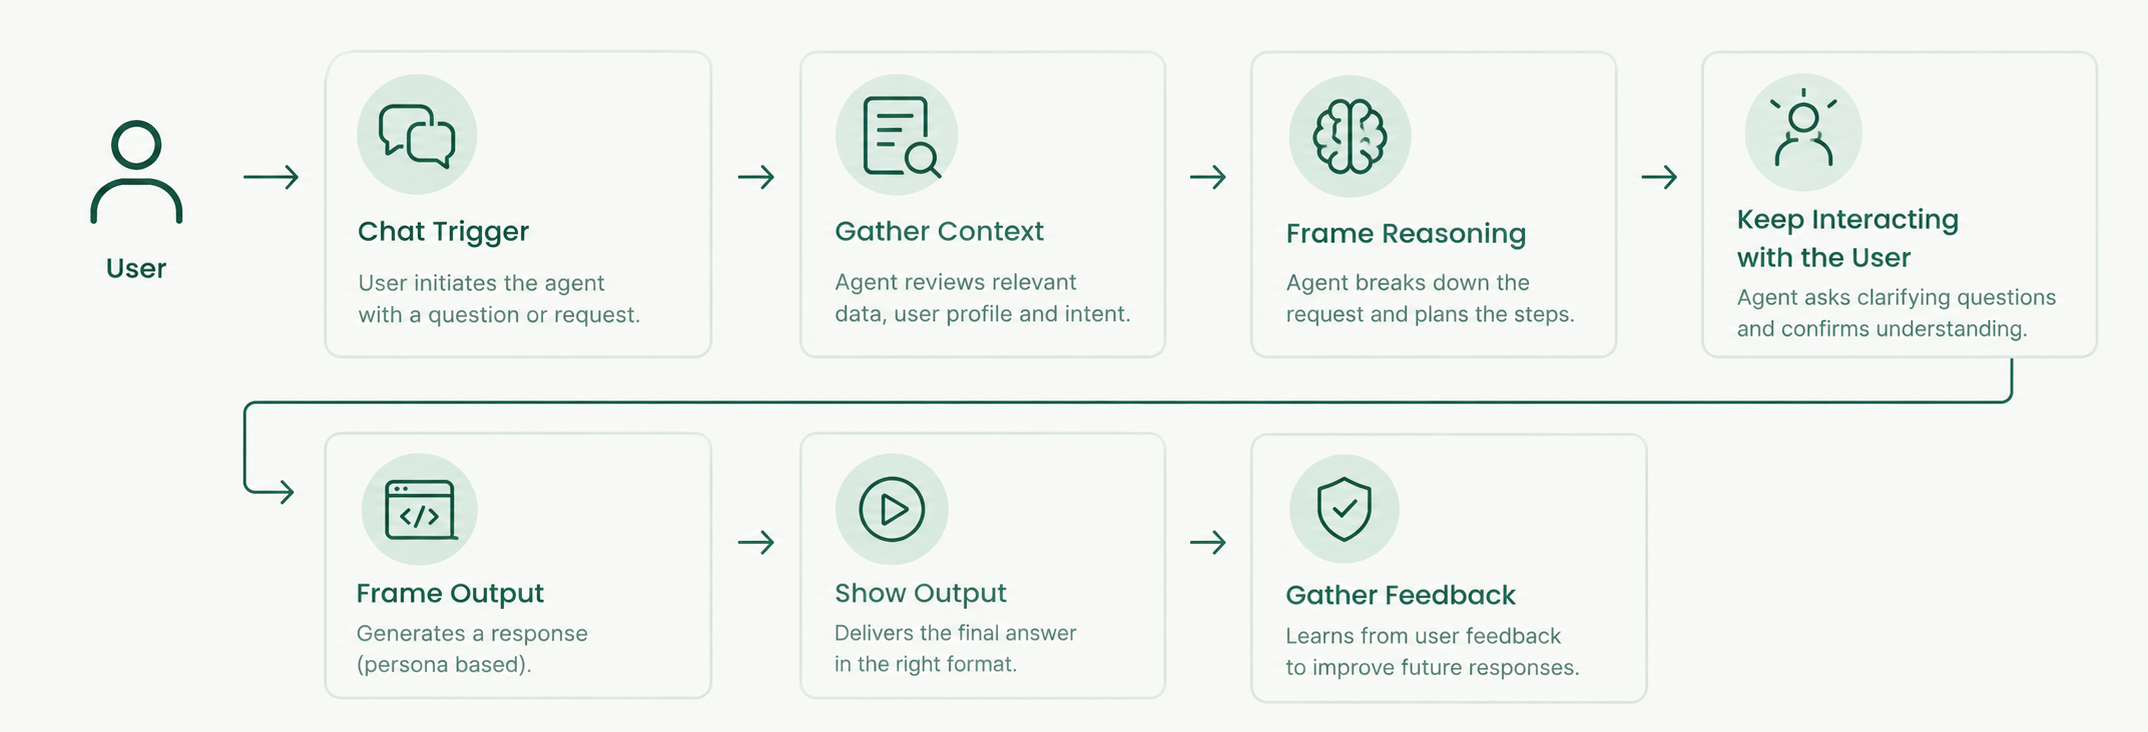
Two layers make up the workflow: how the agent carries a conversation with the user, and what happens underneath each turn to actually produce an answer.
The conversation loop the agent narrates each step it’s taking, then frames its output per persona before asking for feedback.The pipeline underneath knowledge base, memory, tools, and guardrails, working together to turn a query into a persona-appropriate story.
Validation was done in iterative loops. The process: problem identification, justification of a model, a user story for the agent specific to each persona, and continuous evaluation applying guardrails and controls to reduce hallucinations. I used the HHH (Honest, Helpful & Harmless) evaluation method to verify model performance.
Designing the experience
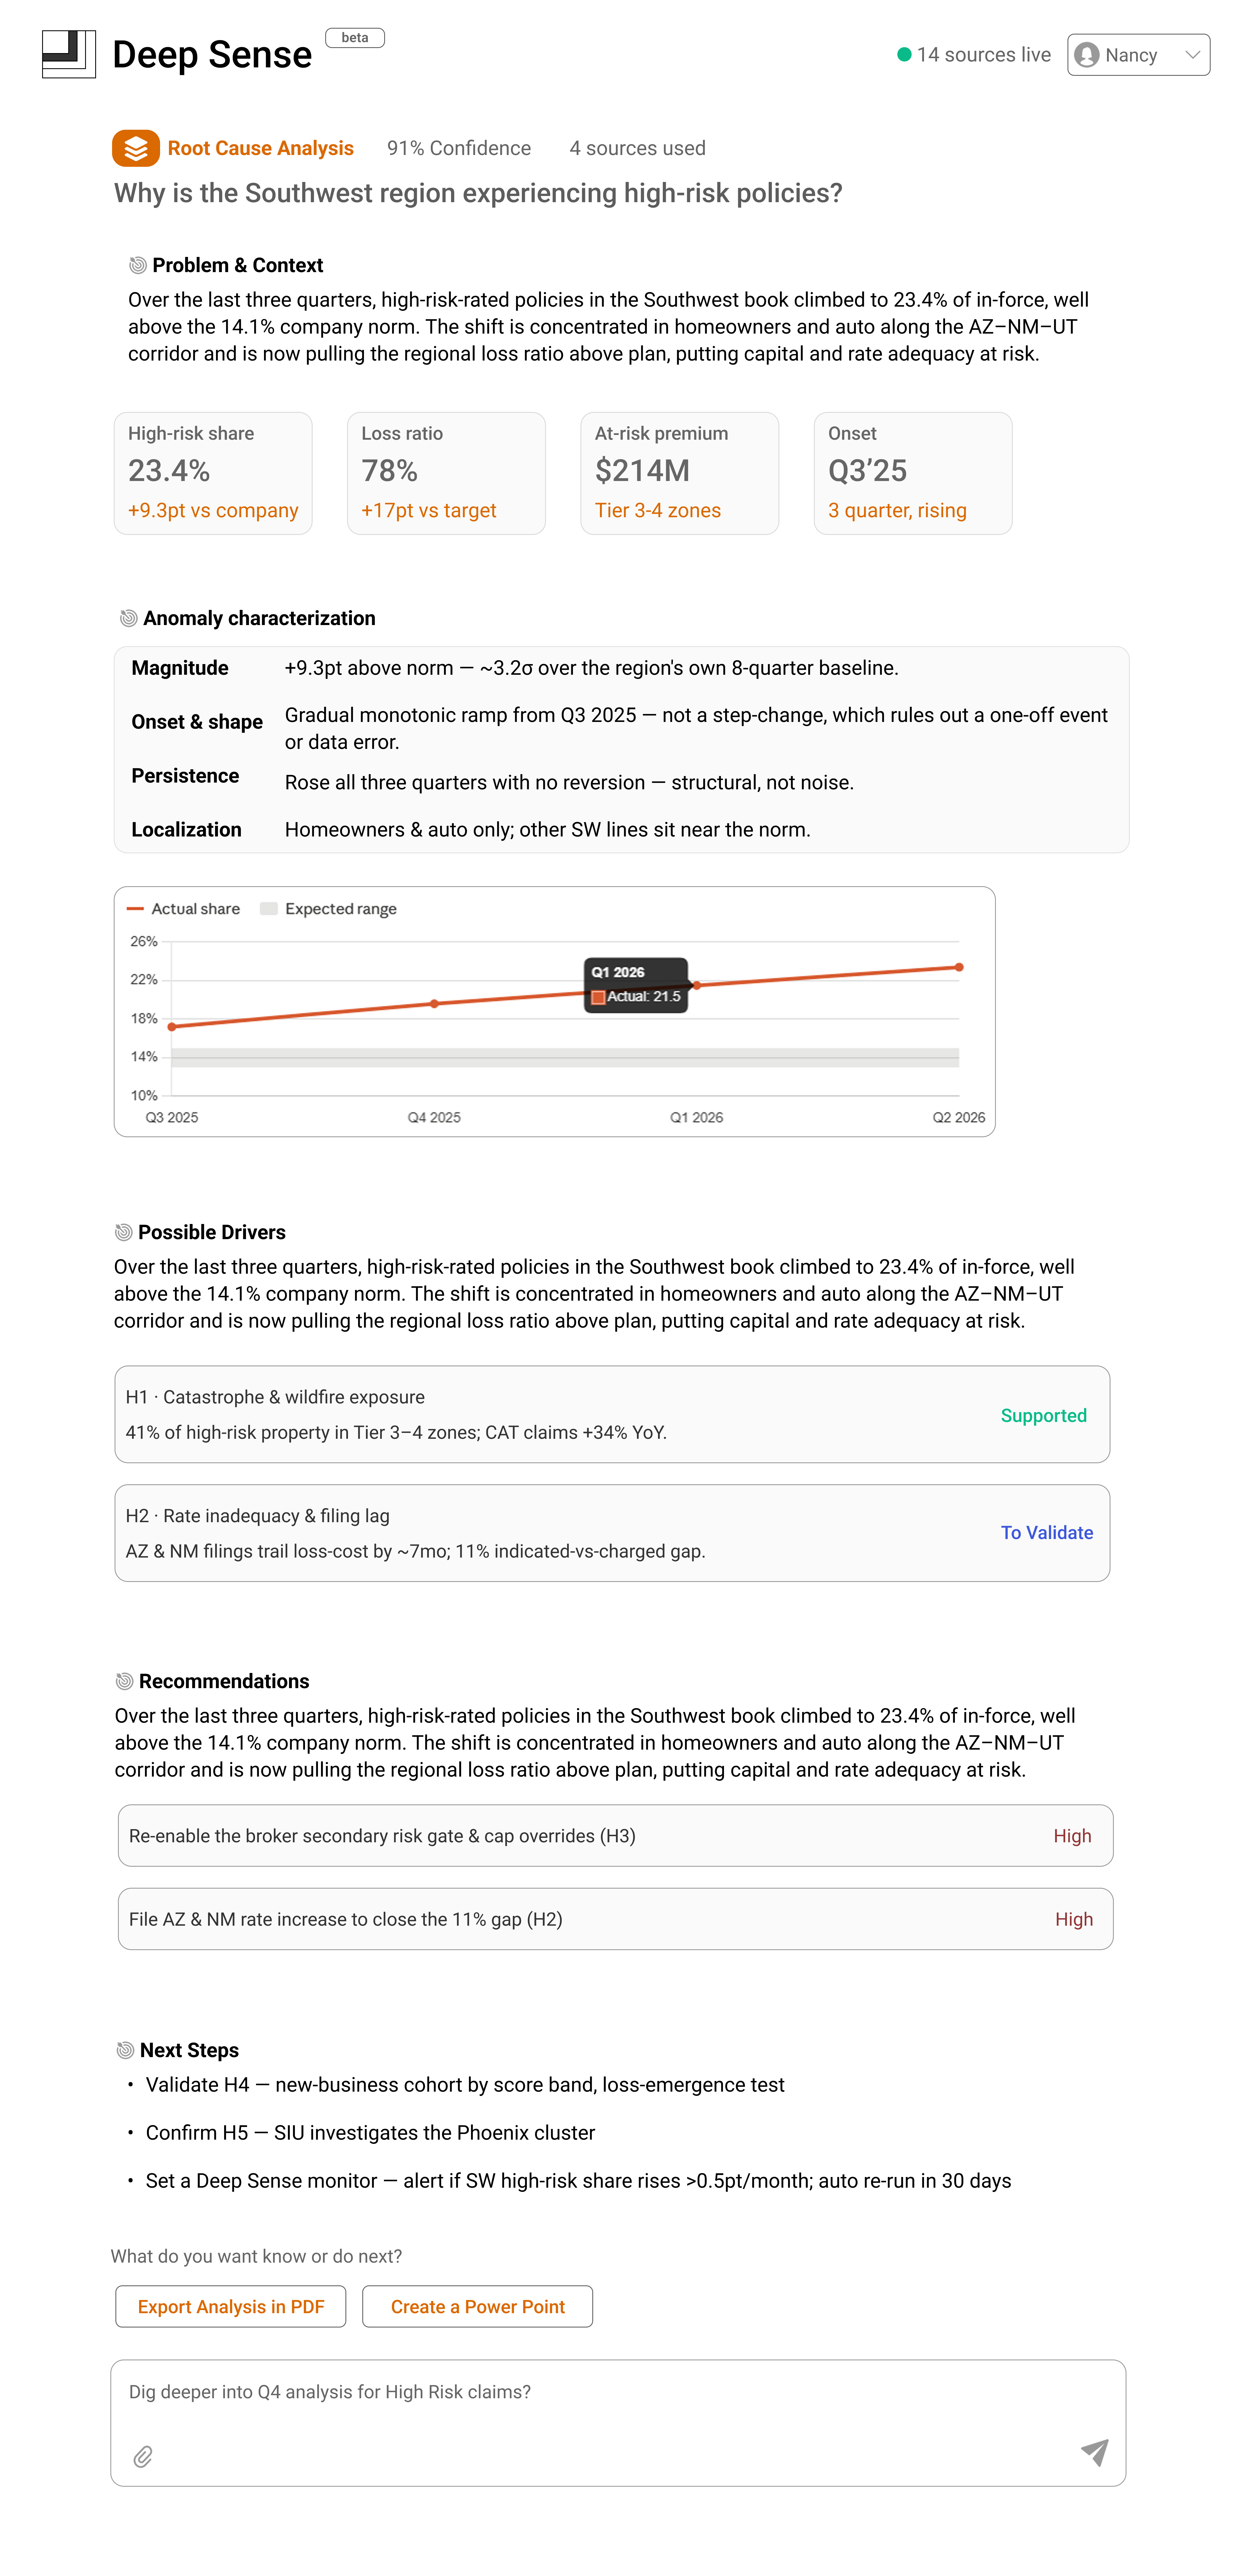
Three pillars, one entry point the user picks their path, DeepSense picks the mode
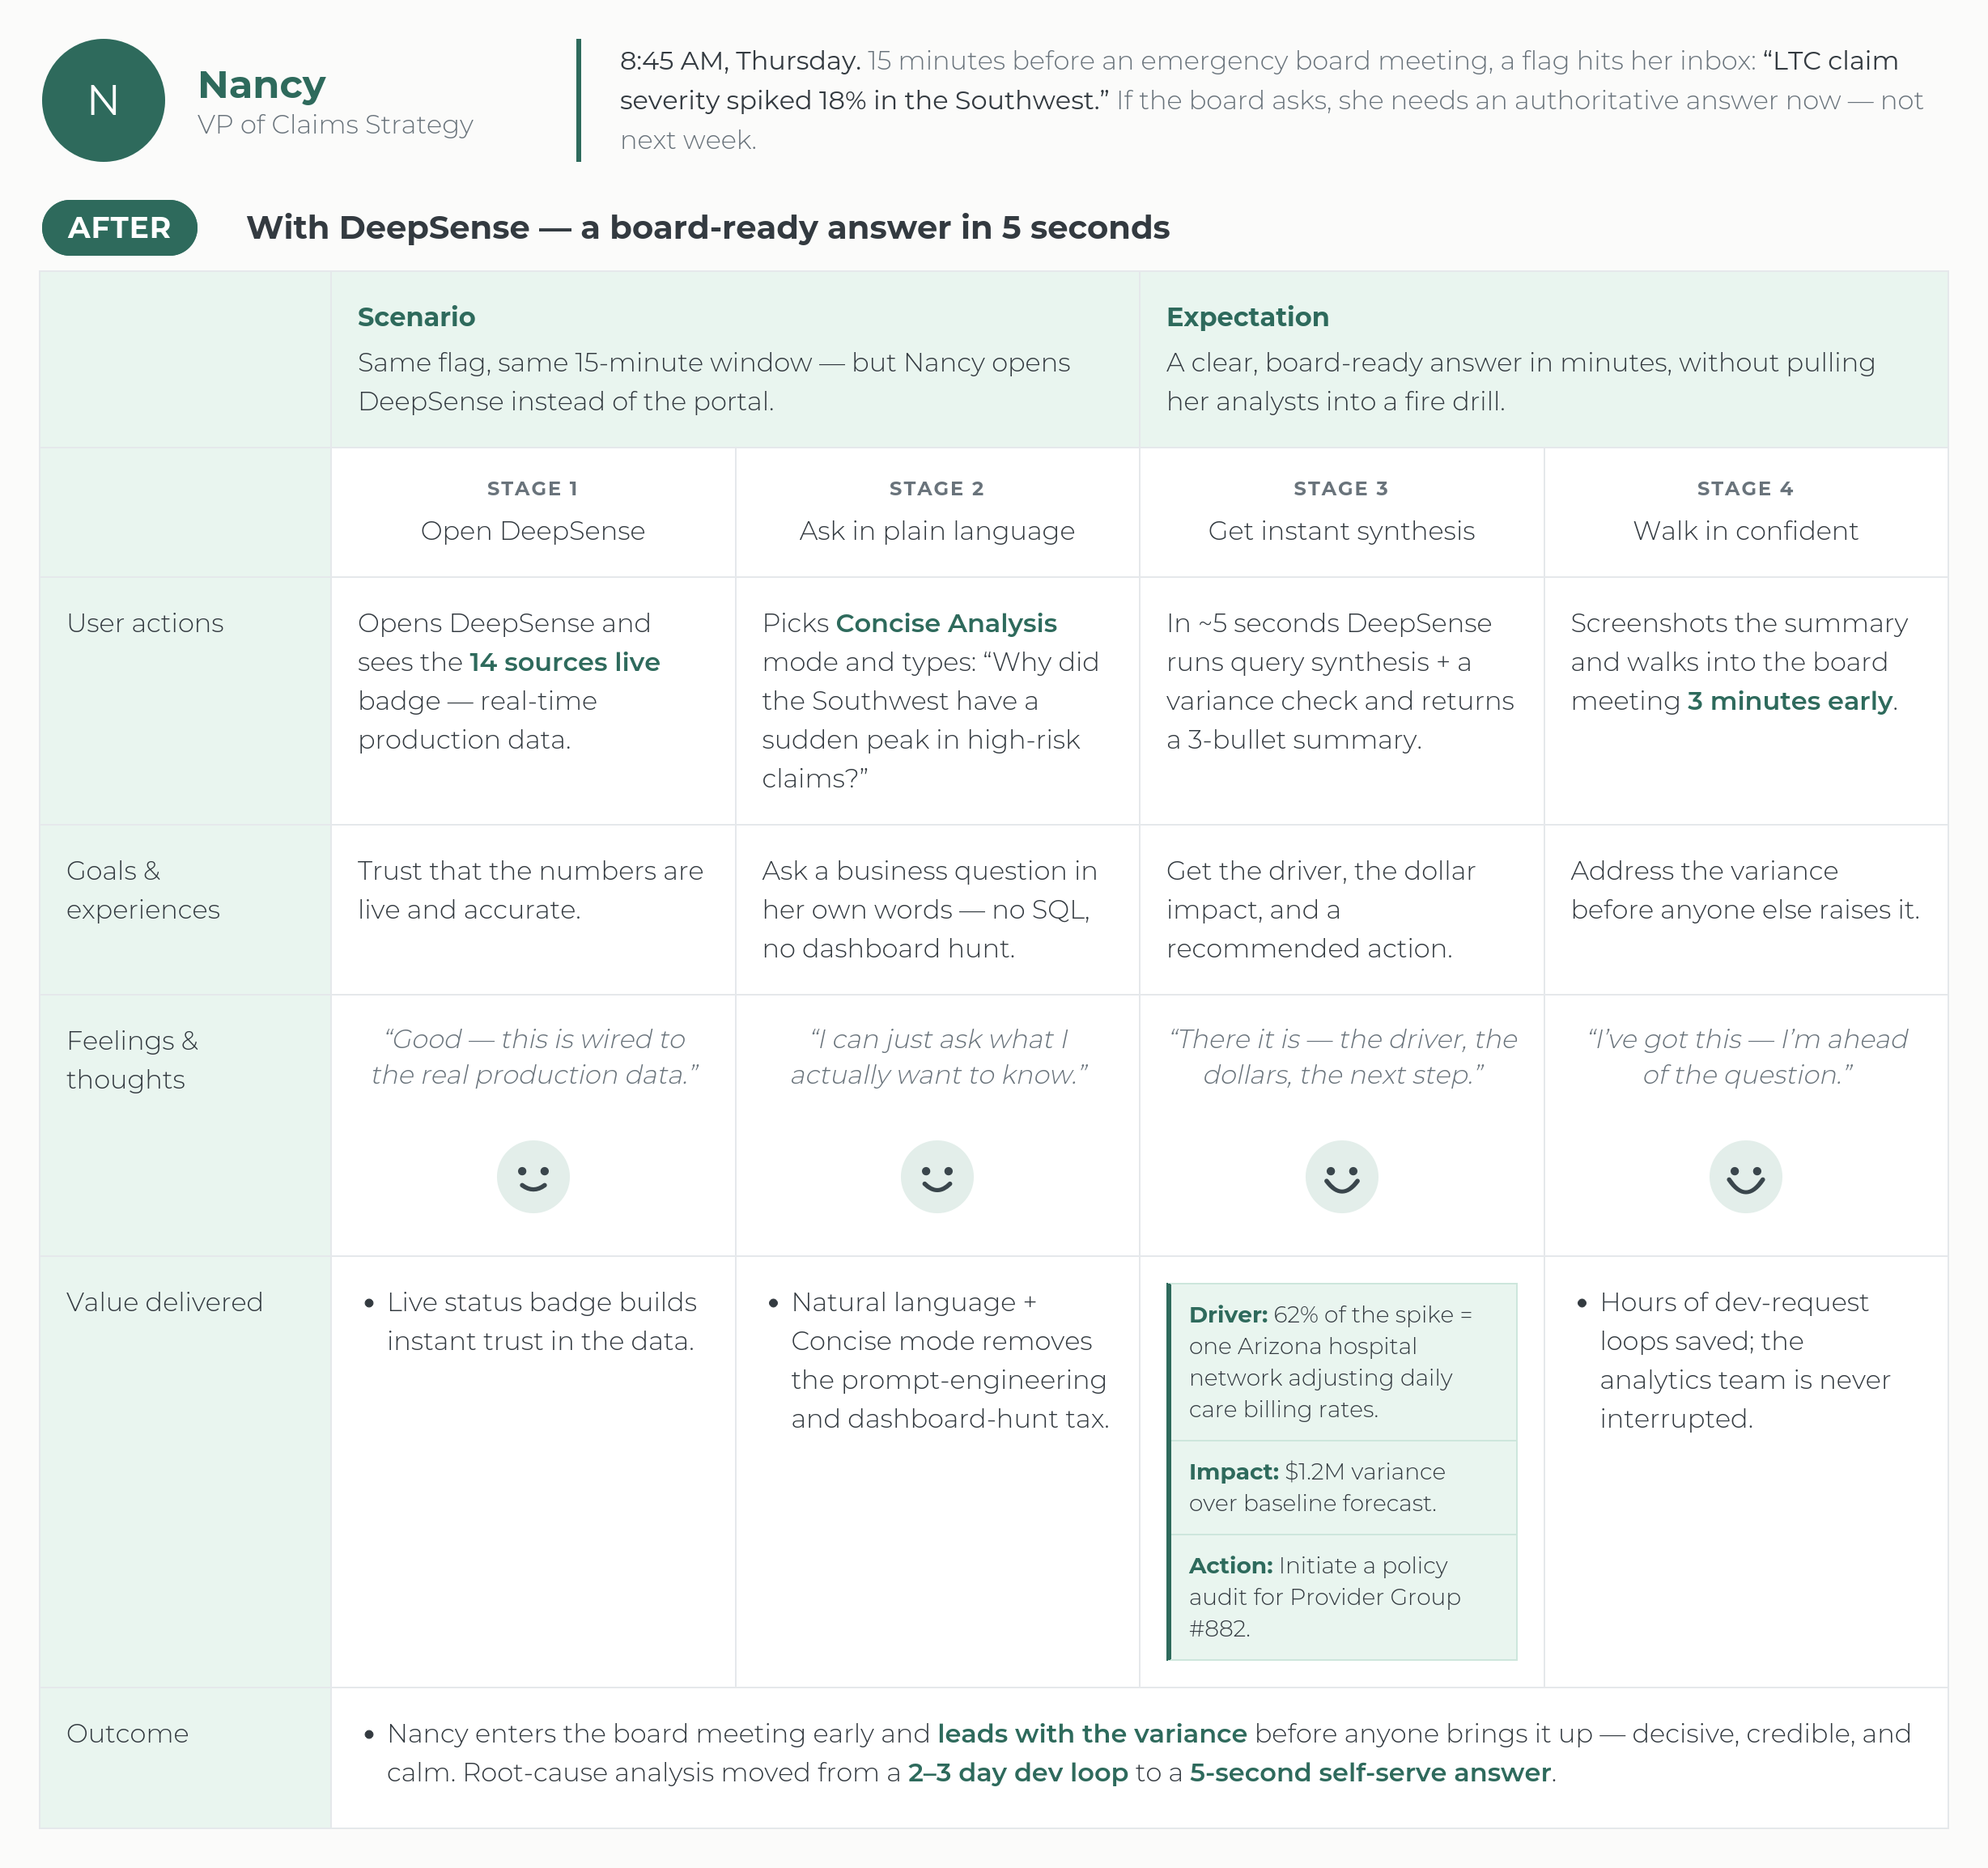
The user selects their own path to get to their findings. Below is the snapshot of Root Cause Analysis flow.
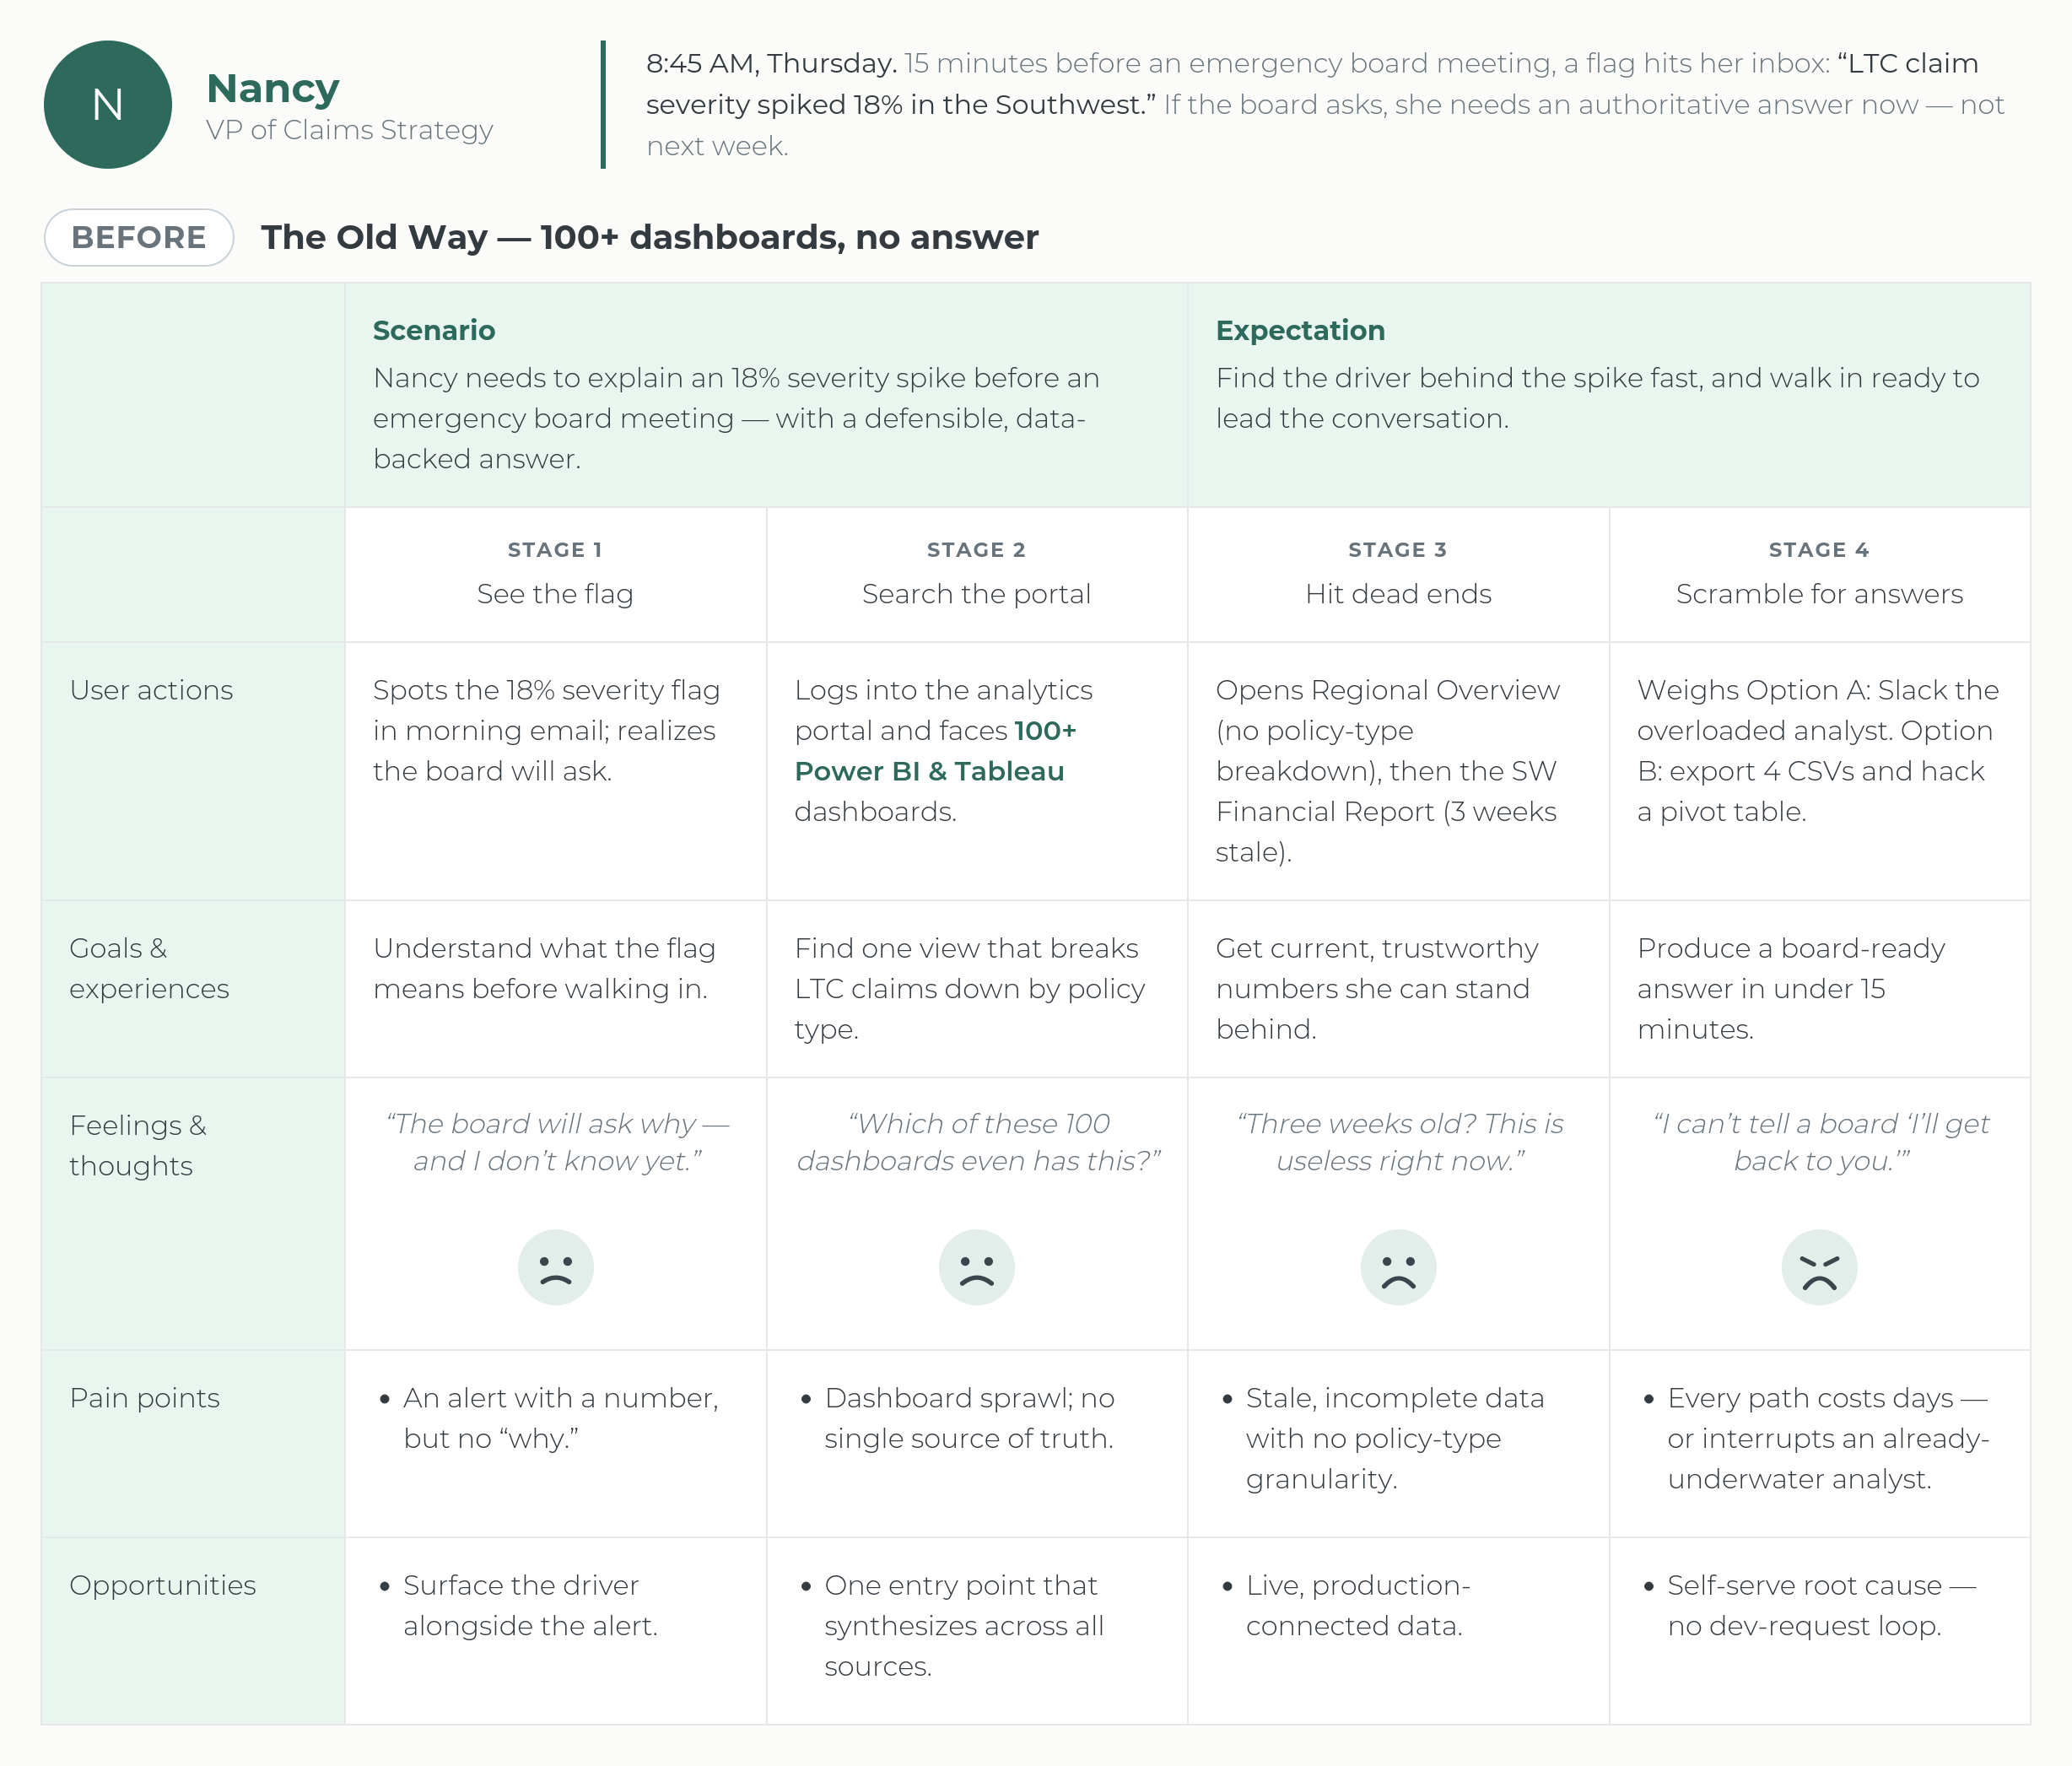
Journey map: Nancy, VP of Claims Strategy
Impact
From a multi-day dev loop to a self-serve answer in seconds
Increased analysis efficiency for all 3 personas by 30%, by running automated variance analysis and live code interpretation.
Reduced executive metric lookup time from ~15 minutes to under 30 seconds.
Reduced time-to-insight by 33% on average across all 3 user groups cutting data-digging time and making answers available in about 30 seconds on average, across all query types.
Unified 100+ siloed dashboards into a single natural-language interface.
Learnings
The real design problem in agentic AI isn’t the interface it’s the judgment behind it
Building the agent taught me as much about restraint as it did about AI. The guardrails capping what the agent could claim, requiring it to show its work, keeping a human in the loop for anything consequential took longer to get right than the orchestration itself, and they mattered more. It’s easy to make an agent sound confident; it’s harder to make it trustworthy enough that someone would act on its word in a high-stakes moment. That’s the real design problem in agentic AI: not the interface, but the judgment behind it.